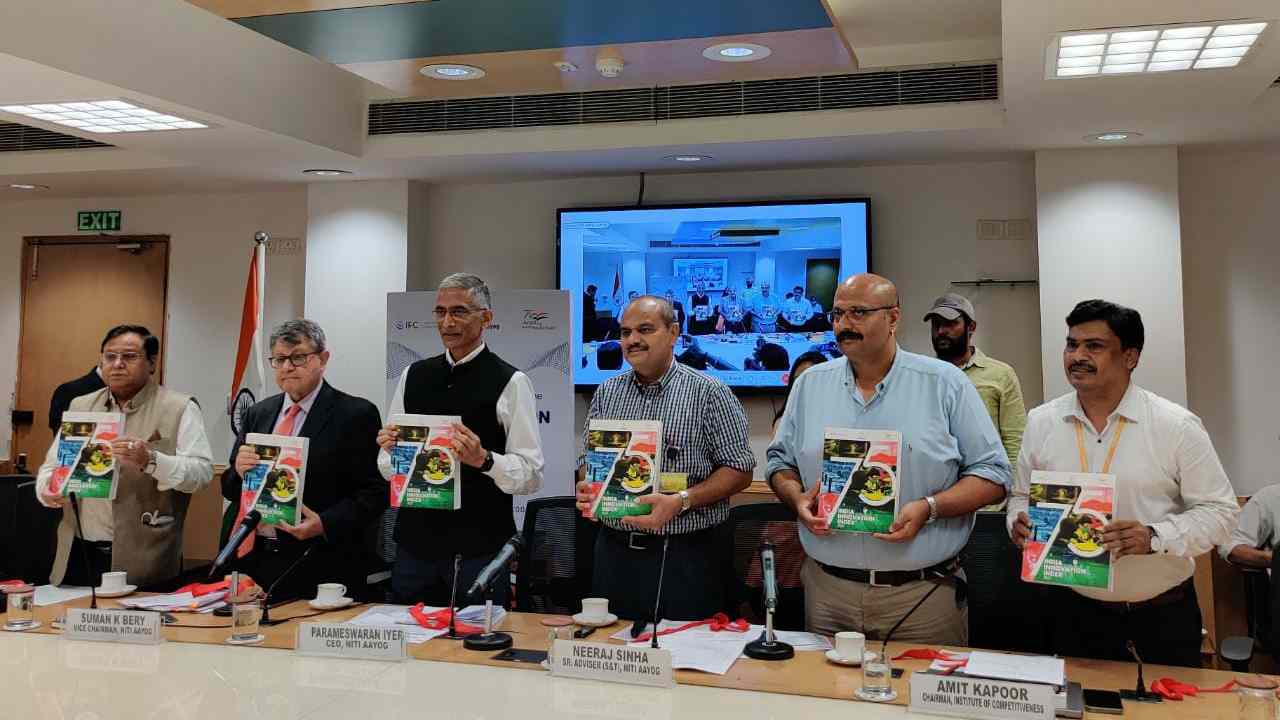
Karnataka, Manipur and Chandigarh have topped in their respective categories in the third edition of NITI Aayog’s India Innovation Index, which was released today by NITI Aayog Vice Chairman Suman Bery.
While Karnataka has topped again in the ‘Major States’ category, Manipur is leading the ‘North East and Hill States’ category and Chandigarh is the top performer in the ‘Union Territories and City States’ category.
The third edition of the India Innovation Index 2021 too is set against the backdrop of the Covid-19 pandemic, which has disrupted the global socio-economic landscape. But human resilience and crisis-driven innovation have kept India and the world afloat in these difficult times. The third edition solidifies the scope of innovation analysis in the country by adopting the framework of the Global Innovation Index (GII) and expanding the number of indicators from 36 to 66 across seven key pillars.
NITI Aayog Member Dr VK Saraswat, CEO Parameswaran Iyer, Senior Adviser Neeraj Sinha, and Institute for Competitiveness Chairman Dr Amit Kapoor were also present at the release of the report. “Innovation is the key to sustainable and inclusive growth. It can help us solve the biggest challenges of our times: bringing millions out of poverty, generating livelihood opportunities, and paving the way for an Aatmanirbhar Bharat,” said Saraswat.
“I would like to reaffirm NITI Aayog’s continued commitment to monitoring the state of innovation in India through the India Innovation Index. We strive to improve the innovation ecosystem across the nation in partnership with the states and other stakeholders,” said Iyer.
Prepared by NITI Aayog and the Institute for Competitiveness, the India Innovation Index is a comprehensive tool for the evaluation and development of the country’s innovation ecosystem. It ranks the states and the union territories on their innovation performance to build healthy competition amongst them.
The third edition highlights the scope of innovation analysis in the country by drawing on the framework of the Global Innovation Index. The number of indicators has increased from 36 (in the India Innovation Index 2020) to 66 (in the India Innovation Index 2021). The indicators are now distributed across 16 sub-pillars, which, in turn, form seven key pillars. The contours of the India Innovation Index 2021 remain the same as last year. Similar to the previous edition, the five ‘enabler’ pillars measure inputs and the two ‘performance’ pillars measure output. All the indicators in the enabler pillars cover features crucial for promoting innovation within a state or Union Territory. Indicators in the performance pillars represent a nation’s output in knowledge creation and competitiveness. “Innovation is critical in promoting the country’s resilience and self-reliance. The index points to the decentralization of innovation across all Indian states,” said NITI Aayog Senior Adviser Neeraj Sinha.
“The index also draws some international parallels, which will add to India’s learnings and how we can be on a par with our counterparts,” said Institute for Competitiveness Chairman Dr Amit Kapoor. The India Innovation Index 2021 is a testament to the Centre’s continued commitment to transforming the country into an innovation-driven economy.
The India Innovation Index also contributes to the government’s effort to monitor select global indices through the Global Indices to drive Reform and Growth (GIRG) mechanism, for which the NITI Aayog is the nodal organization. Building on the foundation of the last two editions, the current report presents an in depth analysis of the state of innovation in the Indian economy.
The India Innovation Index has been prepared on the basis of extensive research and critical analysis of the states and union territories. The report presents an evaluation of the innovation readiness of states and UTs and highlights potential challenges that deter the government, businesses, and individuals from fully realizing their potential.
The third section presents the learnings and recommendations derived from a detailed study of the innovation ecosystem at the state and national levels. This section includes the profiles of all the states and union territories and provides a comprehensive picture of every region’s current innovation environment. The last section of the report contains the appendix, which consists of detailed data tables for all the framework indicators and sources and definitions for reference.
The study is a detailed guidebook for relevant stakeholders to track regional progress on innovation-driven endeavours and inform policy recommendations through context-specific strategies derived from state-level analysis.
The report says that States and UTs have performed well on almost each pillar. There are a few exceptions, as Maharashtra and Telangana didn’t perform well on the pillars of investment, knowledge workers, and safety and legal environment. This was due to their low performance on certain indicators. For example, Maharashtra and Telangana performed relatively poor in terms of expenditure on higher and technical education (6th and 11th from the bottom).
They also performed low in expenditure on science, technology and environment as a percentage of GSDP. Moreover, Telangana performed low in NGOs involved in knowledge-intensive areas. Its performance was average with respect to the number of women employed with advanced degrees. Telangana also had just 5 cyber cells. Both Maharashtra and Telangana had low number of police personnel (per lakh of the population) – about 175 and 131 respectively, which is below the national average of 371.

