Tatsat Chronicle Magazine

#Election2024: Economic Performance Remains Below Par After 10 Years Of Modi Rule

Modi came to power by promising to turbocharge the economy and projecting himself as a reformer, but the numbers reveal it is more sound than light. In certain areas, his economic performance has slid below the 2014 mark
April 22, 2024
Modi
PM after addressing the Nation on the occasion of 77th Independence Day from the ramparts of Red Fort, in New Delhi on August 15, 2023.

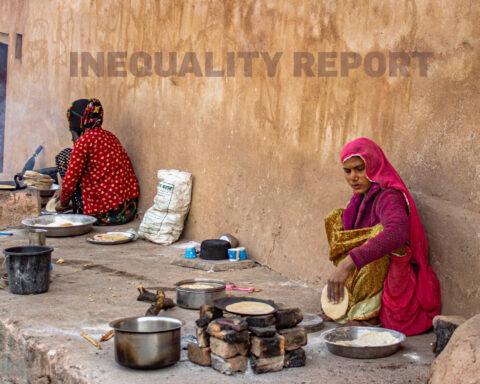
Ten years ago, in 2014, Gujarat Chief Minister Narendra Modi claimed the prime minister’s position on the platform of economic development and as a sure shot executor of projects. His party made more than a dozen commitments (see box).Looking back, we find that growth during his tenure has been slower than during that of Prime Minister Manmohan Singh, whose government was accused of policy paralysis. Rather than trickling down, prosperity has stuck to the top, while the lower half is running on empty. India’s top 1% income share is among the “very highest in the world,” says a report by The World Inequality Database. Unemployment is high, especially among educated youth, and there is an increase in low-paying agricultural employment.

Modi
©Tatsat Chronicle

GDP Growth: More Sound Than Light

India’s economy grew by 76% (at 2011-12 constant prices) from ₹94 trillion in 2013-14 to ₹172.90 trillion in 2023-24. In the previous 10 years, the Congress-led UPA government of Prime Minister Manmohan Singh raised the economy by 93% from ₹50.78 trillion in 2003-04 to ₹98 trillion in 2013-14. Singh was hampered by strong global economic headwinds. The global financial crisis of 2008-09 hit the economy hard; growth that year was 3.1%. Modi had to contend with economic disruption caused by the Covid-19 pandemic. GDP growth in 2020-21 was –5.8% percent.

Perhaps the government’s over-the-top reaction in the form of a sudden and harsh two-month-plus lockdown, and reluctance to take states along in managing the crisis, contributed to the hard landing. The ill-advised demonetisation of November 2016, when 86% of currency was withdrawn from circulation, was another blow to the economy. Its blowback endured. All this resulted in annual economic growth averaging 5.94% under Modi compared to 6.82% under Manmohan Singh.

Modi
©Tatsat Chronicle

Per capita income under the Congress-led UPA governments grew 2.4 times in inflation-adjusted terms from ₹28,635 to ₹68,572. Under Modi the increase was 1.5 times to ₹106,134. While there have always been high levels of income disparity, under the Modi government they have touched historic highs because of the concentration of wealth in a small section of society.

In the head-to-head comparison of GDP growth, Manmohan Singh outperformed Narendra Modi by close to 1 percentage point, which is a significant reflection of Modi’s inadequate handling of the economy. 

Agriculture: Growth Pace Maintained, But Income Growth Sluggish

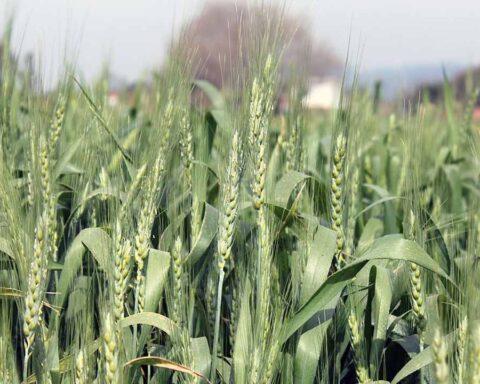
In its very first budget in 2014, the government said it would aim for 4% average annual growth in agriculture. That commitment has been nearly met. Agricultural growth has averaged 3.61% during the past 10 years, slightly higher than 3.47% during the previous 10 years. But gross value added in agriculture increased by 42% during the past 10 years, which is a mere 2% increase over the 10-year term of Manmohan Singh, when it clocked 40%.

But have farmers’ incomes doubled in the five years till 2022 — a promise which the prime minister made at a rally in Bareilly in February 2016?  The value that farmers received for their produce after adjusting for inflation rose 25% in the five years till 2021-22. Without adjusting for inflation, it increased by 61%.

If Modi meant a doubling of farmers’ incomes (without regard to the source), the target may have been achieved if one includes the annual transfers of ₹6,000 to farmer households since the beginning of 2019. According to Budget documents about 125 million farmer families may have gained from this scheme.  This should cover most farming households, estimated to range from 90 million to 150 million.

But agriculture has become a sink for workers who cannot find employment elsewhere. The number of people engaged in the sector increased by more than 50 million between 2019 and 2022 from 190.7 million to 246.5 million, reversing the earlier trend when the economy was creating jobs to absorb people moving out of agriculture.

The share of agricultural Gross Value Added (GVA) is a low 15% and around 44% of the workforce is dependent on low-paying jobs. The pandemic-related economic slowdown has aggravated the trend of individuals returning to subsistence activities in agriculture due to lack of work opportunities outside, says the India Employment Report 2024, published jointly by the International Labour Organisation (ILO) and the Institute of Human Development (IHD).

Manufacturing Growth: Bombast Not Matched By Outcome

On September 25, 2014, Modi launched the Make in India initiative at Vigyan Bhavan to facilitate investment, build best-in-class infrastructure and make India a hub of manufacturing, design and innovation.

The policy aimed to increase the share of manufacturing in GDP from 16% to 25% by 2022, the government told the Lok Sabha. The government also launched Production-Linked Incentive (PLI) schemes in 14 sectors to boost manufacturing for export with a mix of incentives and higher import duties.

A Press Information Bureau (PIB) release in January 2024 asserts that the PLI scheme has attracted investment of more than ₹1 trillion and generated sales of ₹8.6 trillion, including exports of ₹3.2 trillion. Gross foreign direct investment in the past 10 years was less than $648 billion, and more than double during the previous 10 years ($304 billion).

Despite the hype, the share of manufacturing GVA in the total has averaged 17.83% under Modi versus 17.02% during the UPA regimes. Manufacturing engaged 61.5 million people in 2022 or 11.5% of the workforce.

This was 3.7 million more than in 2019. Merchandise exports under UPA-I and II governments rose from nearly $64 billion to $314 billion at an average annual rate of 18%. Under Modi, exports have been sluggish. They rose from $310 billion to a peak of $451 billion at an annual average of 4.35%.

But Indian exports should have been helped by global value chains seeking a source other than China and favouring India. Yet, Bangladesh and Vietnam have gained from textile and garment buyers shifting from China due to higher wages there. Indian exports of textiles, fabrics and readymade garments, which are labour intensive, amounted to $31 billion in 2021-22 and remained unchanged from 2013-14.

The leather industry, which also employs more workers per unit of capital, saw exports decline from $5.7 billion in 2013-14 to $4.38 billion in 2021-22.  The government’s ideological disapproval of the meat industry and of cattle trade has been a major factor. The shift away from leather to synthetics is another.

Under the UPA, exports of leather and leather products more than doubled. The Economic Surveys of Chief Economic Adviser Arvind Subramanian (when Arun Jaitley was Finance Minister) had emphasised the need to boost garment and leather exports to speed up GDP growth and make it more job intensive. Buffalo meat exports under the UPA regime rose four-fold in quality and more than 10-fold in value from 0.34 million tonnes worth about $400 million to 1.45 million tonnes worth $4.35 billion. After Modi made dog whistle statements about the “Pink Revolution” during his 2014 election campaign, buffalo meat exports were impacted. In 2022-23, the quantity exported was 1.18 million tonnes valued at $3.19 billion.

Also Read: NITI Aayog’s Deprivation Index Is A Perception Management Exercise

Low-Paying, Unsecure Jobs, and Rising Youth Unemployment

The BJP’s 2024 manifesto asserts that with the Production-Linked Incentive and Make in India programmes, manufacturing has emerged as a major economic sector. The party will work to make India a global manufacturing hub and enhance employment in this crucial sector. It also claims that investment in infrastructure has created plenty of jobs.

The share of manufacturing, we have mentioned earlier, has been around 18 percent during the 10 years of the Modi government, about one percent higher than the average during Manmohan Singh’s tenure as PM. This is contrary to the BJP’s assertion that manufacturing has become a major economic sector. A singular failure of the Modi government has been its inability to produce jobs in the numbers required.

According to the India Employment Report 2024 of the International Labour Organisation (ILO) and the Institute of Human Development, the number of unemployed has doubled since 2012 (two years before Modi became prime minister). A little over 10 million people were unemployed then. The number was 22.9 million in 2022. The unemployment rate has also doubled from 2.1 percent in 2012 to 4.1 percent in 2022.

Modi
©Tatsat Chronicle

In India, open unemployment tends to be low because poor people cannot remain idle; they must earn a living. The problem, the report says, is not so much about unemployment as productive employment.

Though the workforce has expanded from 466.3 million in 2012 to 567.4 million between 2012 and 2022, which roughly corresponds to the Modi years, there are some concerning trends. Three quarters of those in employment are either casual workers, self-employed or engaged in unpaid labour in family economic activities. In fact, the number of unpaid family workers has increased by more than 55% to 94.8 million. The number of casual workers has risen by 12 million and those of the self-employed by 63 million. There has been a slight increase in those in regular formal employment, perhaps because of digitalisation and the goods and services tax.

Another worrying trend is the reversal in the shift out of agriculture. Between 2000 and 2019, the share of agricultural employment fell from 60% to 42%. There was a reversal thereafter owing to the pandemic and migrant workers who returned to villages not being able to find non-agricultural jobs. In 2022, the share of agricultural employment was 45%. The share of manufacturing employment has fallen from 14% percent in 2014 to 12.5% in 2022.

Among youth the labour force participation rate (that is, those in work or seeking it) was lower than that of the entire working age population. It was 42% in 2012, down from 44% in 2012. Their unemployment rate has also doubled from 6.2% to 12.4% during this period. Unemployment in India is predominantly a problem of youth, mainly of educated youth who have completed at least secondary education, says the ILO-IHD report. It has intensified over time. The share of unemployed youth in those without work was nearly 83%. The share of educated youth was nearly 66%, and it has increased over the past few years.

Vivian Fernandes

He is senior journalist and columnist for several reputed publication. He was formerly with CNBC-Network18 and specializes in the agriculture sector and economy. He has written more 450 articles on agriculture alone.